Services
Observability & Operations
Turn operational telemetry into faster diagnosis, defensible service levels and evidence that systems are healthy.
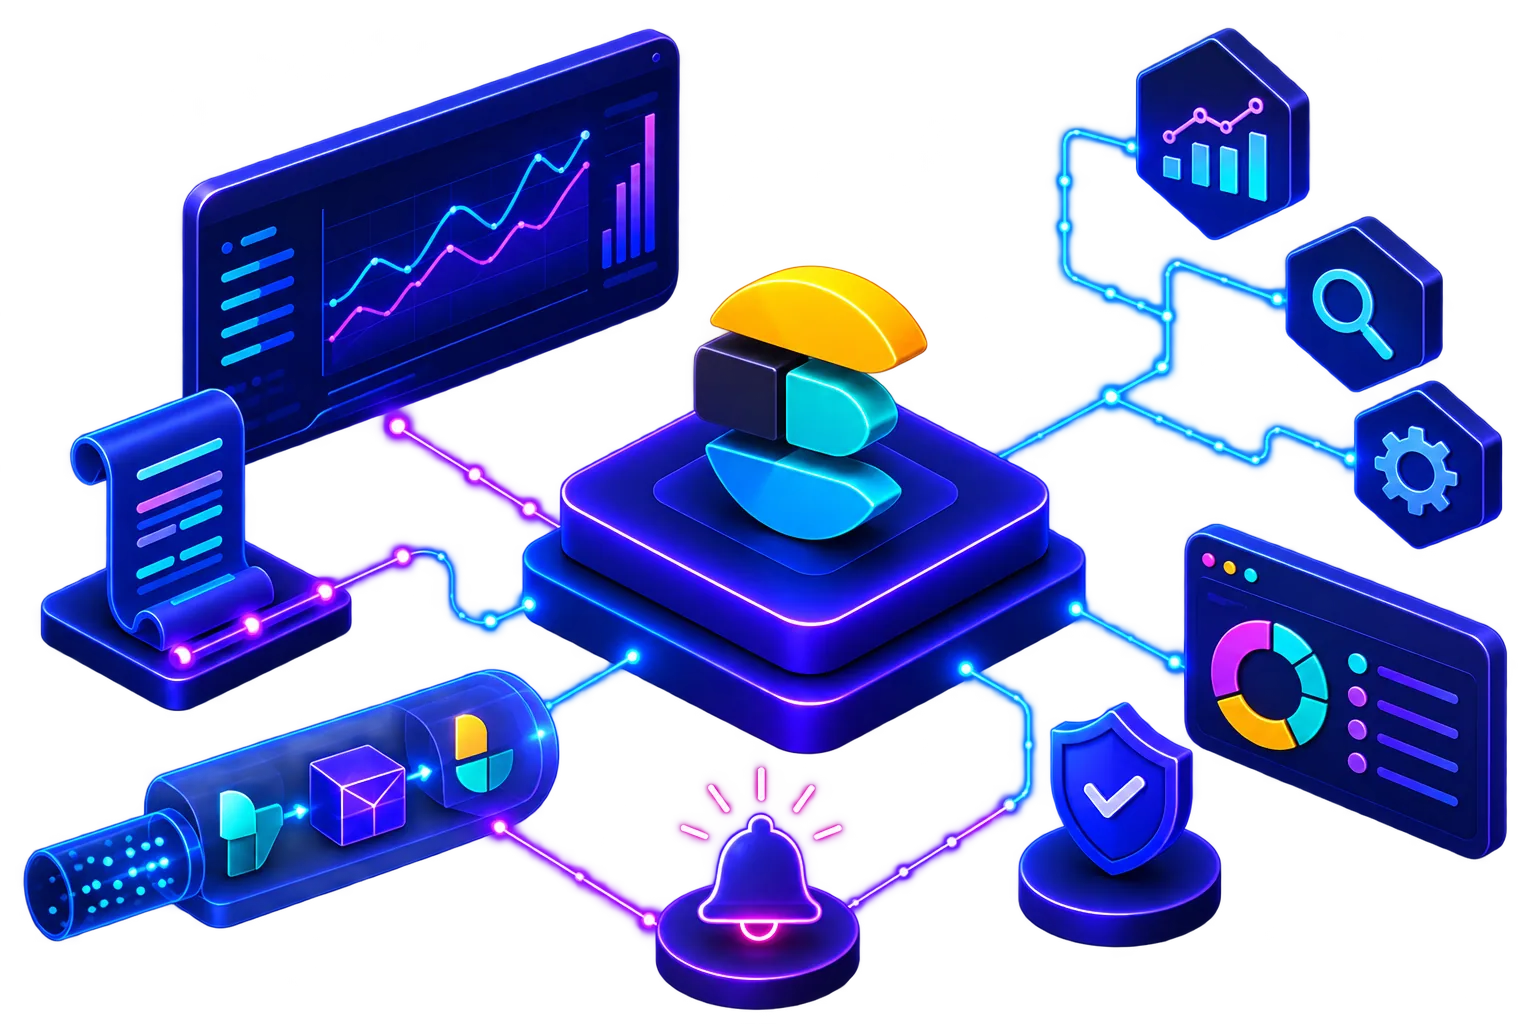
What this delivers
Collecting more telemetry does not automatically improve operations. We begin with the questions engineers, service owners and auditors need to answer, then design log, metric and trace pipelines that preserve the right context without allowing cost and noise to grow unchecked.
Dashboards and alerts are tied to service objectives and real response workflows. Teams spend less time interpreting disconnected signals, incidents become easier to explain, and operational evidence supports both continuous improvement and governance obligations.
Observability & Operations Services
From strategy and architecture through to implementation and ongoing operation, we help you build the capabilities needed to deliver secure, reliable digital services. Engage us for consultancy and design, a complete project deliverable, embedded expertise alongside your team, or as your managed service provider.
Observability (ELK)
Log, metric, and trace pipelines that answer operational questions quickly instead of merely storing data.
Operational data becomes expensive noise when schemas are inconsistent, retention is unmanaged and dashboards are disconnected from service ownership. During an incident, teams then spend critical time locating context and debating which signal reflects the user experience.
We design ingestion, enrichment, storage and visualisation around concrete diagnostic and assurance questions, then connect alerts to service objectives and response actions. Engineers gain faster investigation and clearer trends, while service owners gain defensible reliability reporting and control over telemetry cost.
What we deliver
- Elasticsearch cluster design, index lifecycle management, and retention strategy
- Logstash pipeline design for parsing, enrichment, and routing
- Kibana dashboards and saved searches aligned to real operational questions
- Structured log pipelines with consistent schemas across services
- Monitoring and alerting examples: SLO burn-rate alerts, error-budget reporting, and incident dashboards
- Platform-integrated observability with FluentD log scraping, service mesh telemetry, SLO and synthetic monitoring, and Kubernetes operators
- Elastic
- Logstash
- Kibana
- FluentD
- OpenTelemetry

Need help with observability & operations?
Tell us where you are today and we'll come back with a candid view of what would actually move the needle.